

Bucket Scoring System
When I score albums, I use a standard 1-10 rating scale, but it’s presented more broadly.
Score buckets, represented by a rainbow of color codes serve as review scores, with ranges as follows:
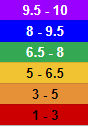
Purple scores are “Perfect” and equal a range of 9.5 to 10
Blue scores are “Excellent” and range from 8 to 9.5
Green scores are “Good” and fall between 6.5 to 8
Yellow means “Okay”, as in not good but not bad, and the album is between a 5 to a 6.5
Orange is “Meh”, between 3 and 5
Red is just “Bad”, and the score, at best, tops out at a 3 out of 10
There are two further buckets: Lavender and Teal, which are used as interim buckets for albums that find themselves right at the score threshold between Blue and Purple (Lavender) or Green and Blue (Teal). These are given time for additional consideration throughout the year before final decisions are made, and get priority over the next bucket down when considering ranking.
This approach allows me the benefit of additional time and perspective before ranking albums, whereas trying to nail down a specific to-the-tenth score could skew my final ratings depending on how much more positive I was feeling in September than in June, for example.
Why colors? Why does it have to look like a rainbow?
Glad you asked! Two reasons:
I’m a nerd, and I worked at a space and science museum for like a decade. The visible portion of the EM spectrum just felt like a simple, compelling, and colorful way to label my bucket tiers.
There are some people in this world who are now uncomfortable when they see rainbows. I find their discomfort amusing.
Questions?